Possible warning-level Christmas Eve snow ahead

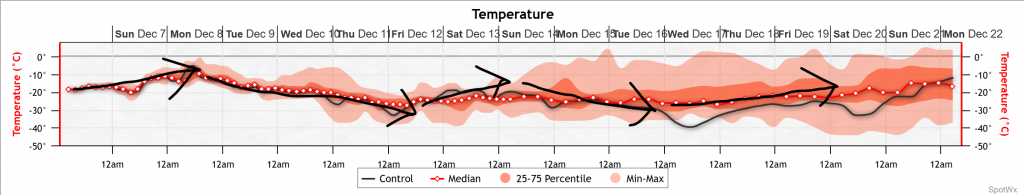
Here you go, the first post during winter break. Temperatures thus far have stayed cold and will continue to do that for the rest of the week. Right now though, our eyes are on tomorrow, when a good system will come through and bring possibly warning-level amounts of snow.

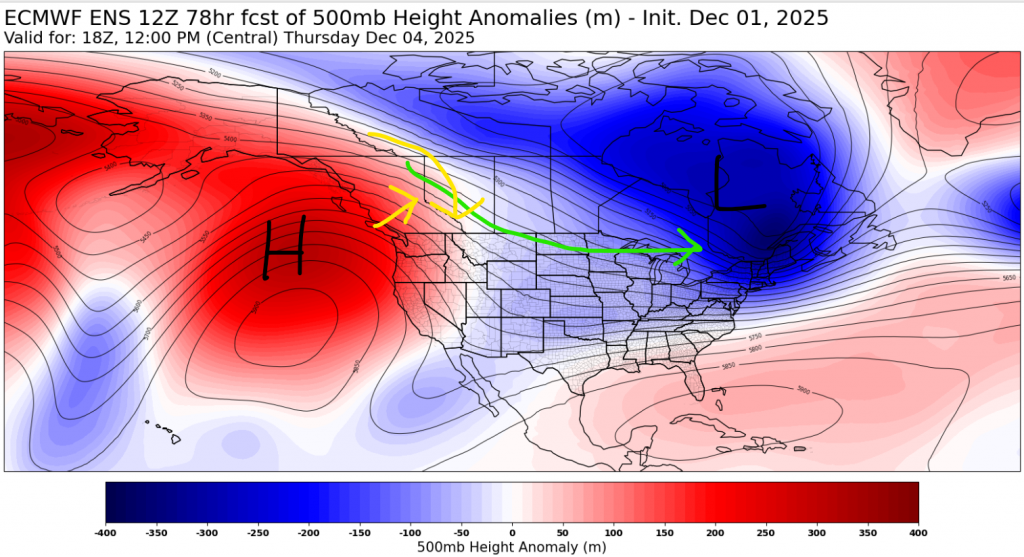
We begin right now, with upper air analysis and surface analysis maps from Environment Canada:

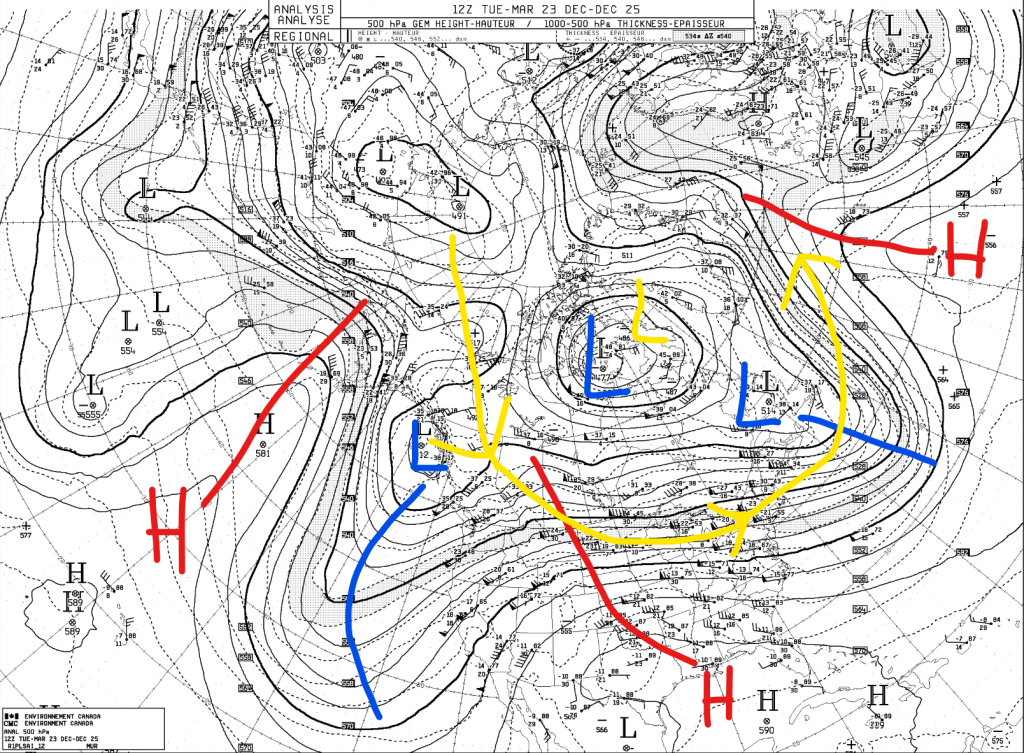
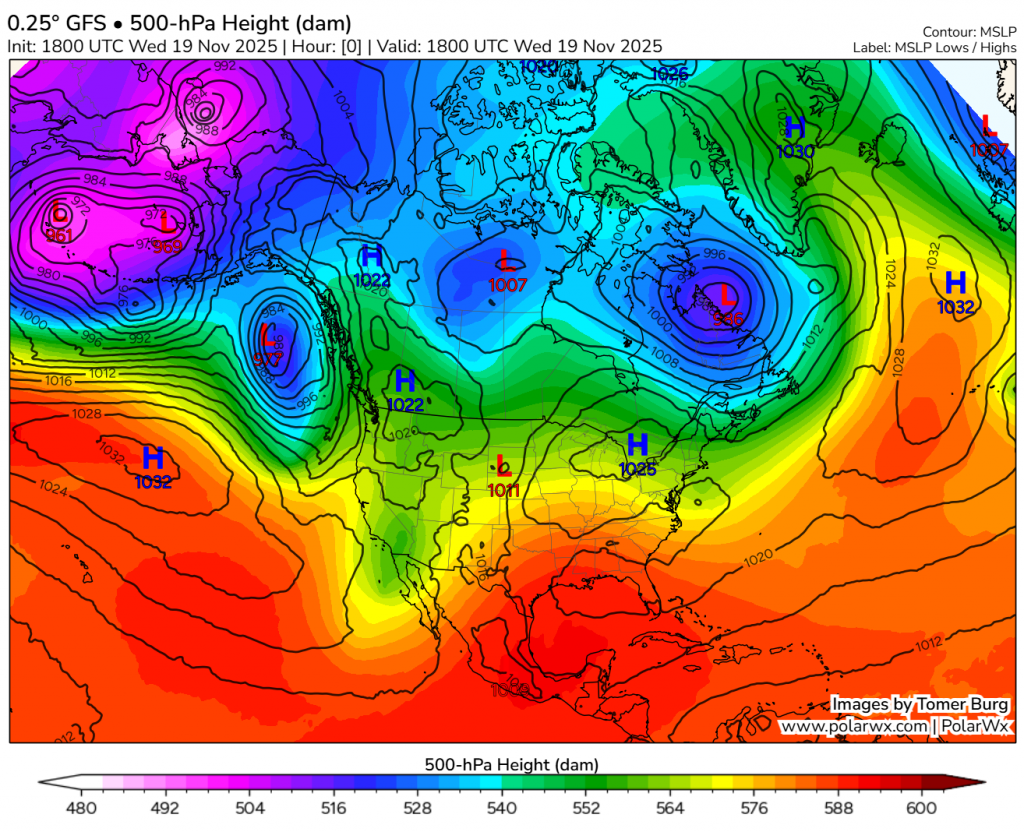
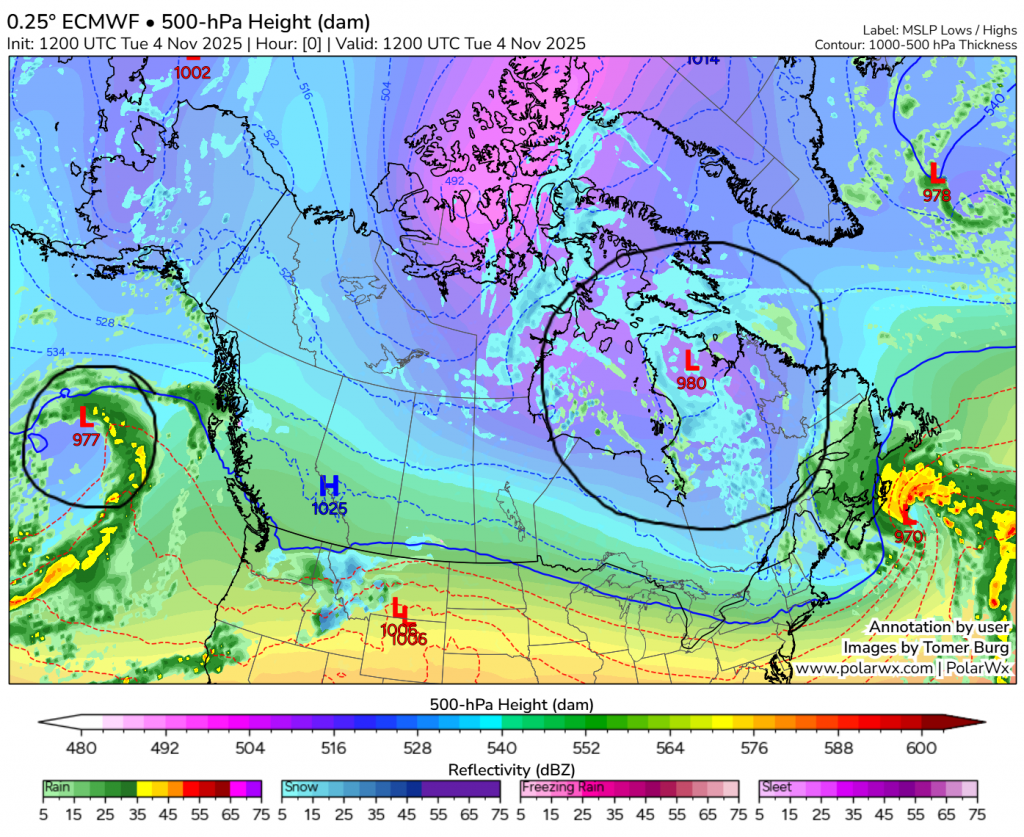
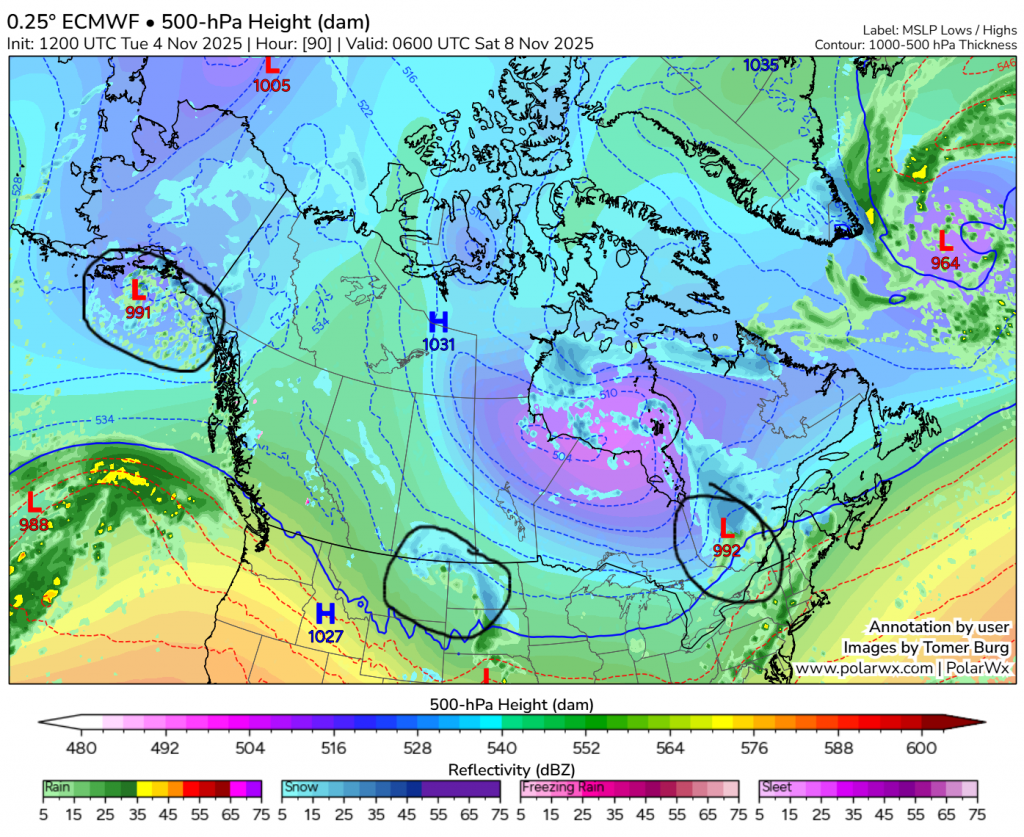
On the left map, we can see the overall flow at 500 hPa. We still have our now multi-week triple upper-low system over Canada, with an anchoring low in Nunavut, and two digging lows over the BC coast and the Maritimes. We also have upper ridging over the Bering Sea, the Prairies, and the eastern Atlantic. The yellow line is where the polar vortex is, and the yellow L is the stratospheric low anchoring it. The most below average temperatures are along the yellow line.

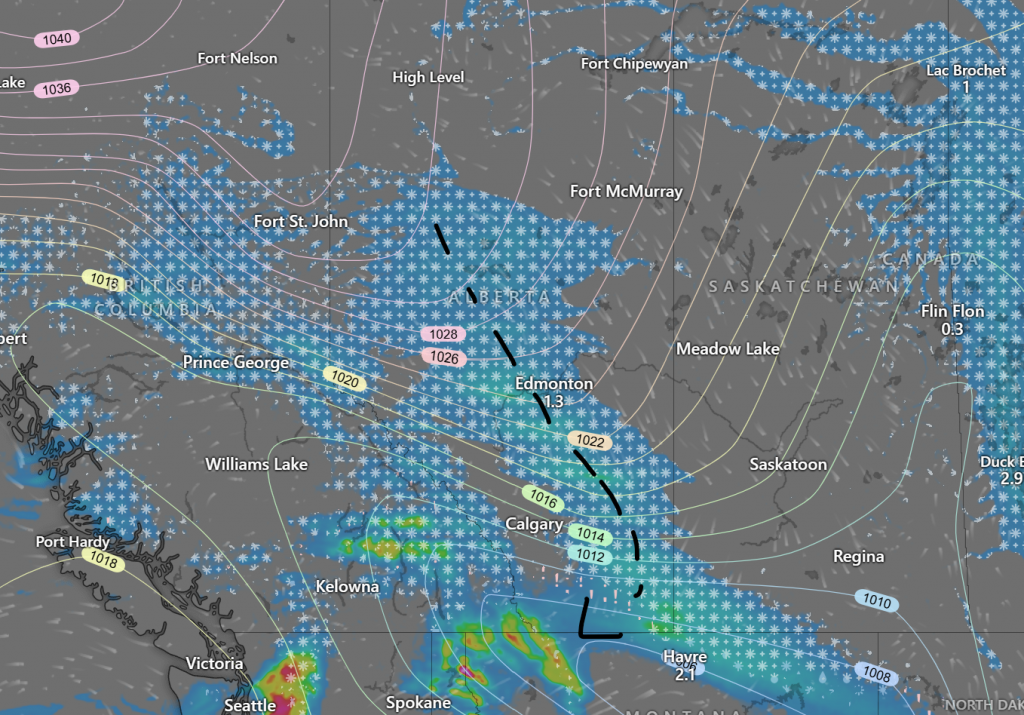
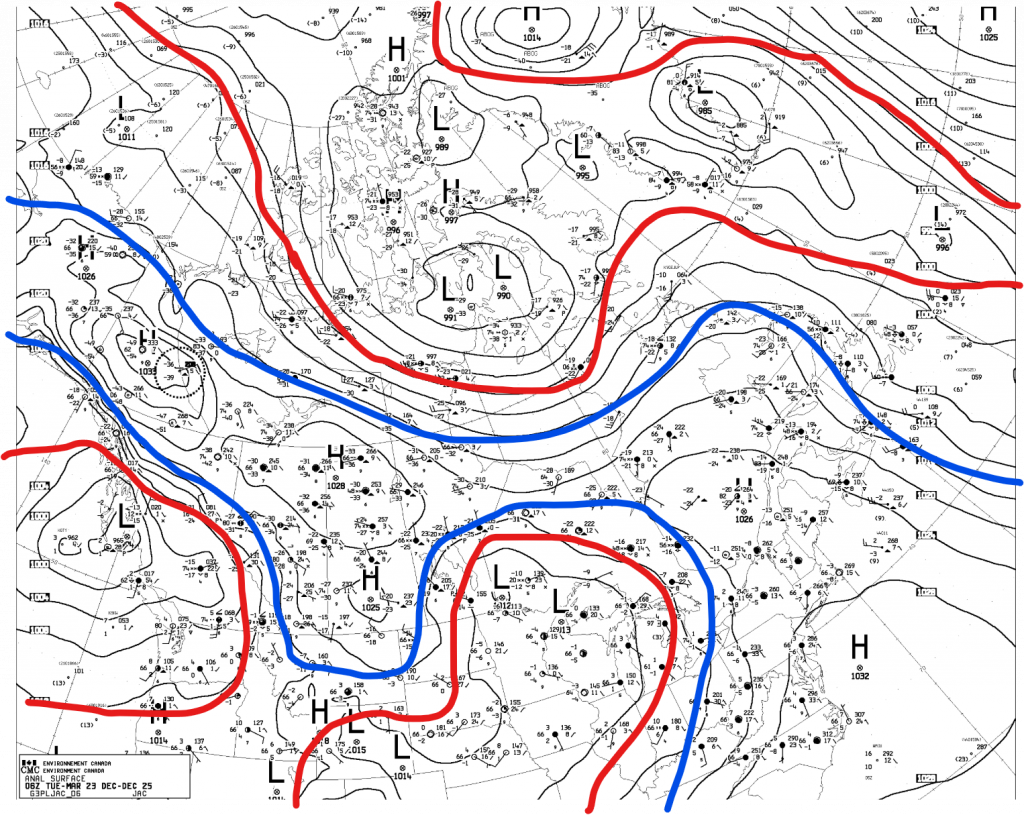
On the right map, we have surface analysis. I have outlined areas of high and low pressure so you can see them better.

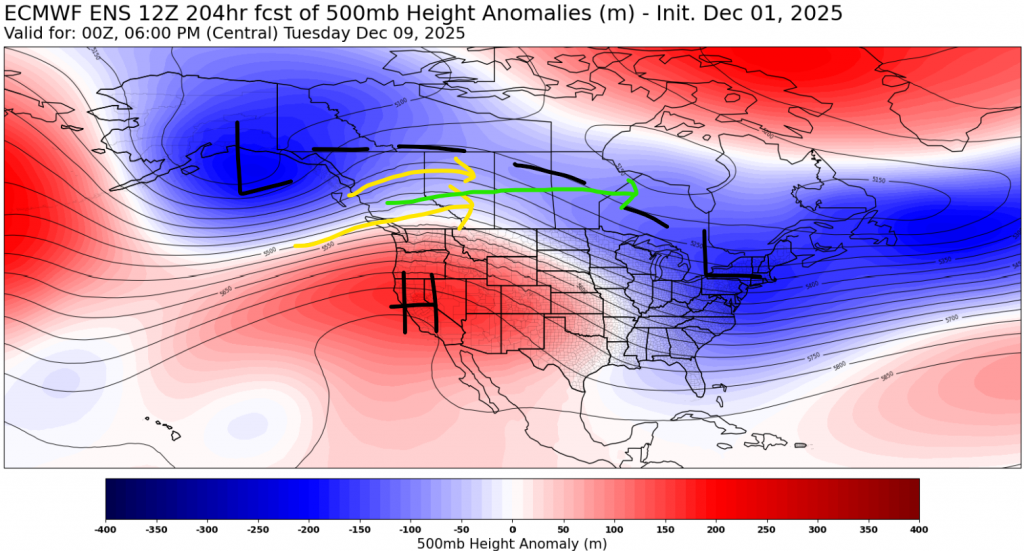
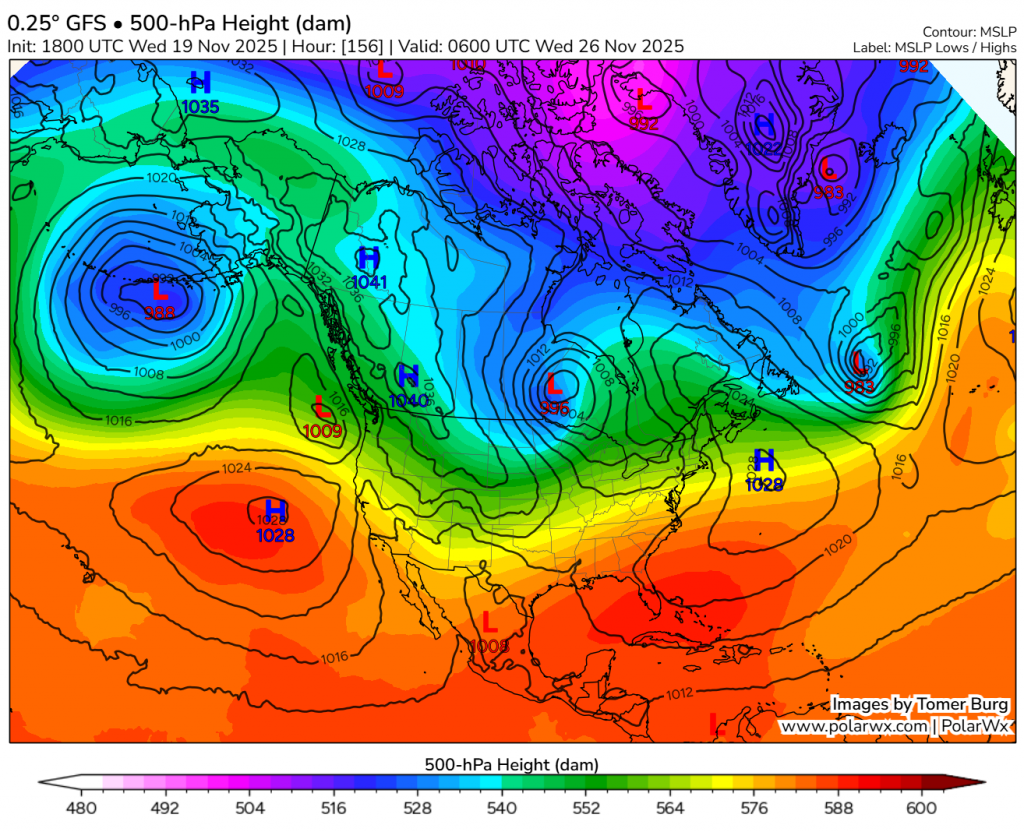
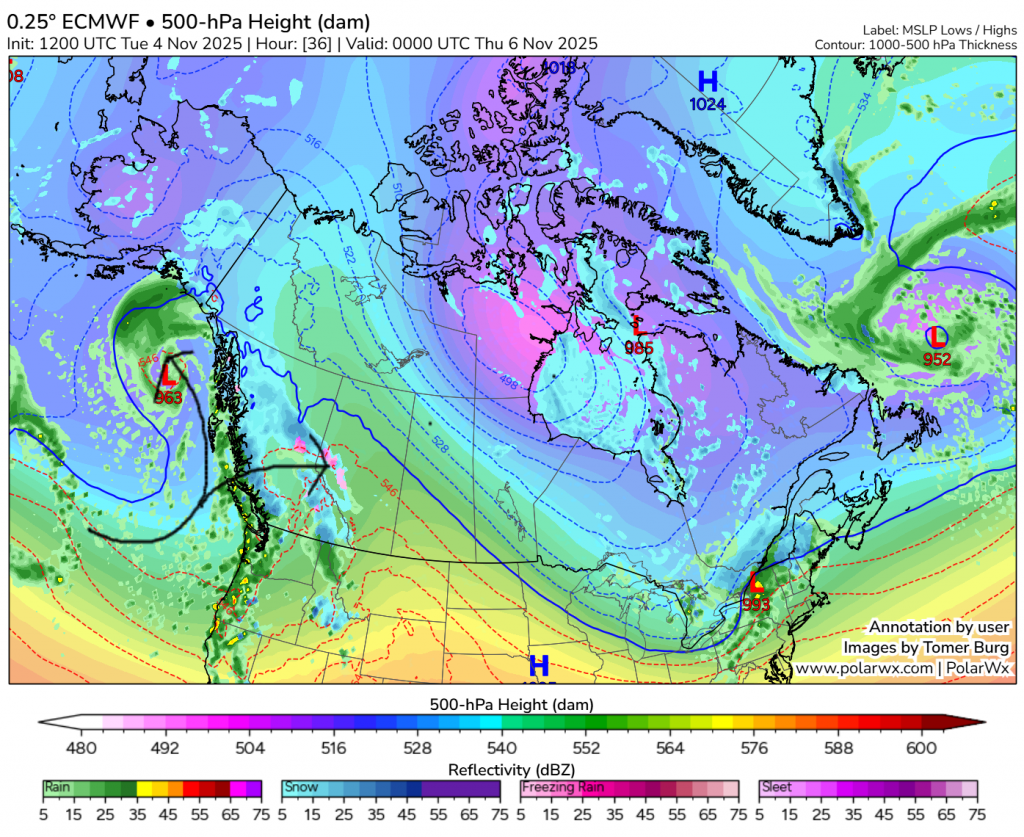
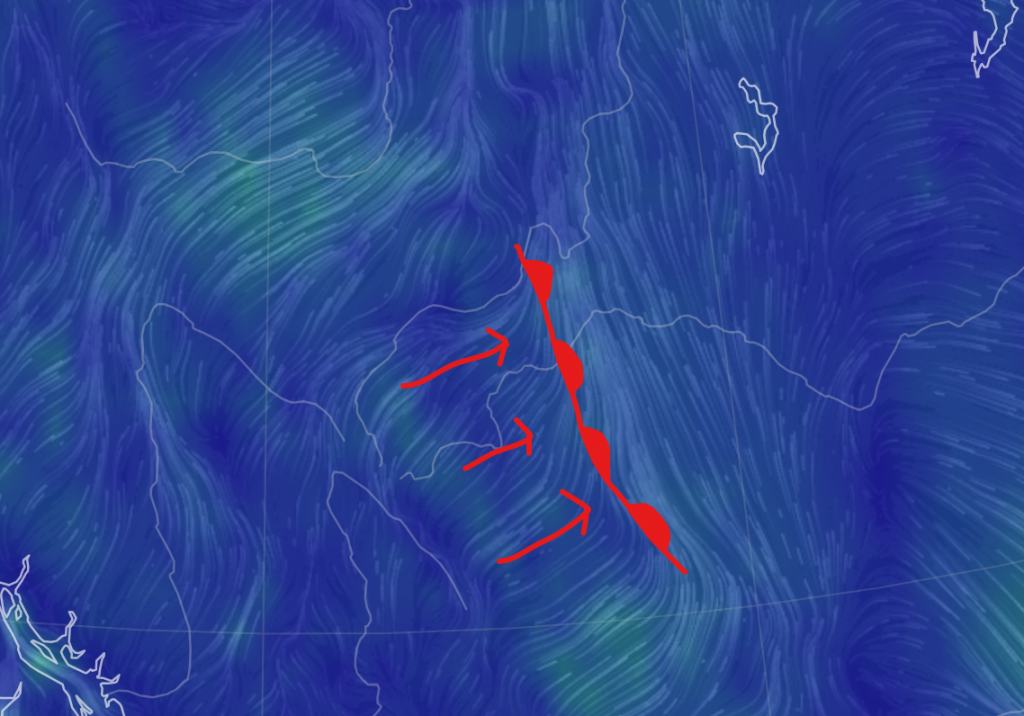
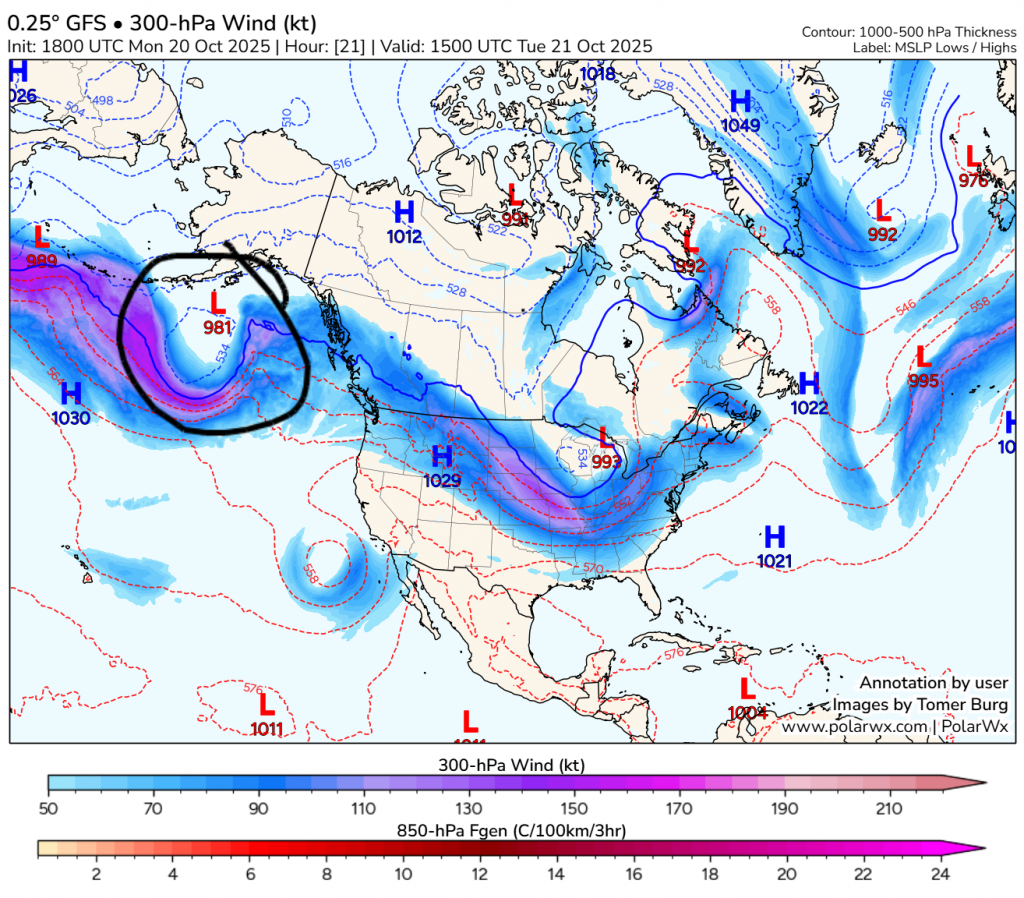
Now for the forecast. To begin, we will have to look at the low in the bottom left of the right image; the one around the coast. A shortwave trough is going to develop on the coast of the US from this low, and will quickly overpower it, turning into a deep system. It will continue to run up the coast, but once it hits Canada near midnight tonight it will split: A weaker trough off the southern BC coast, and a stronger one in the SE corner of BC.

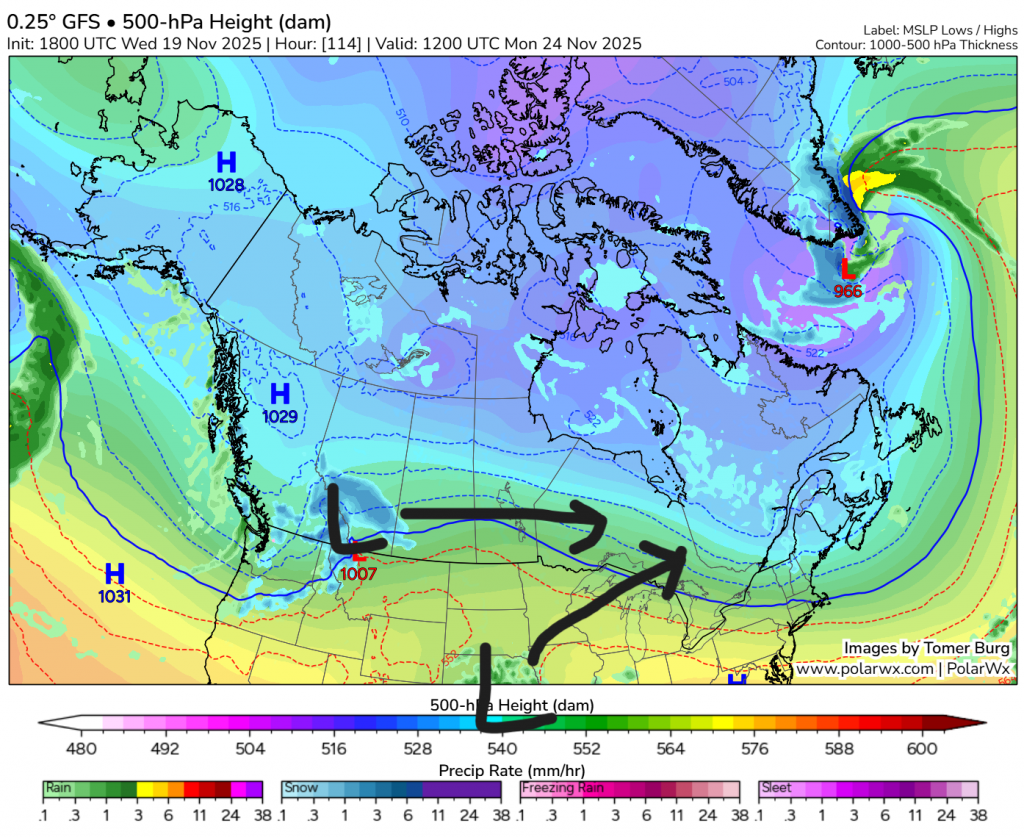
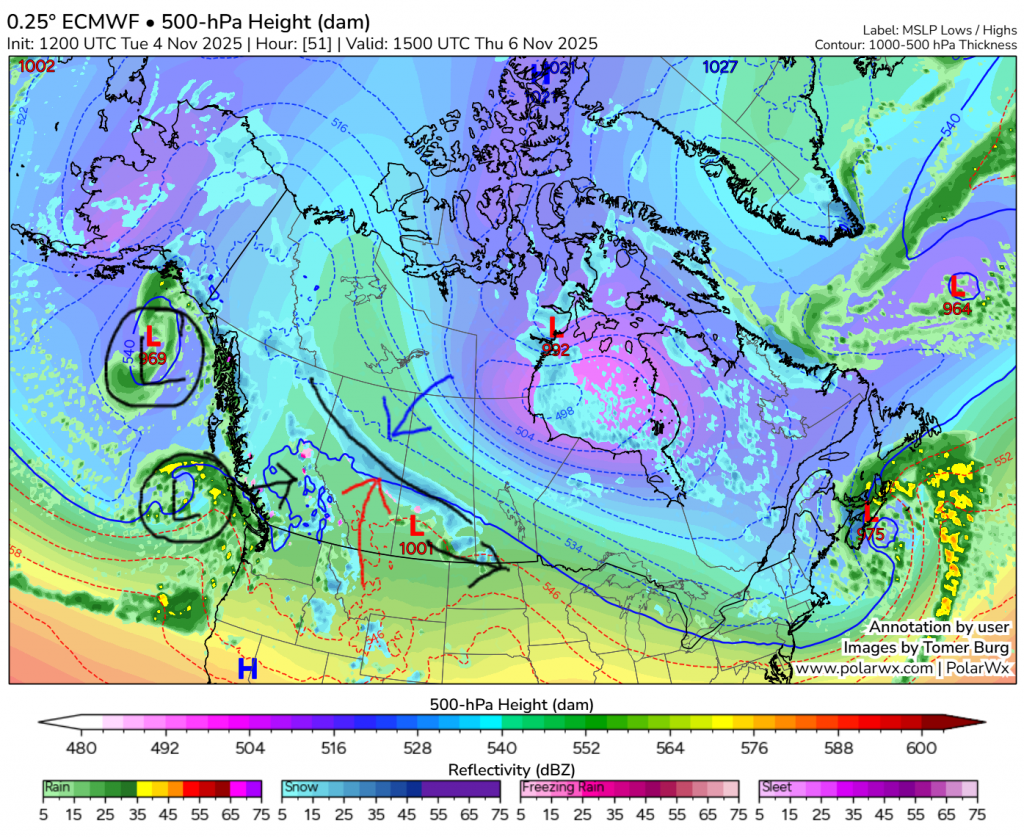
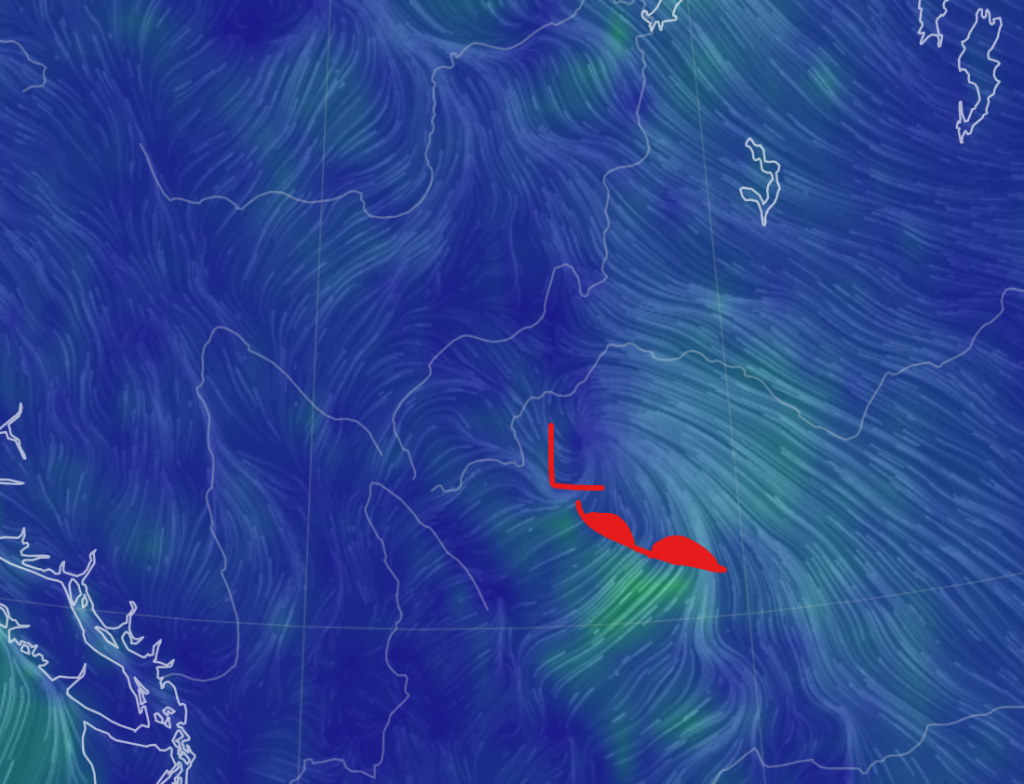
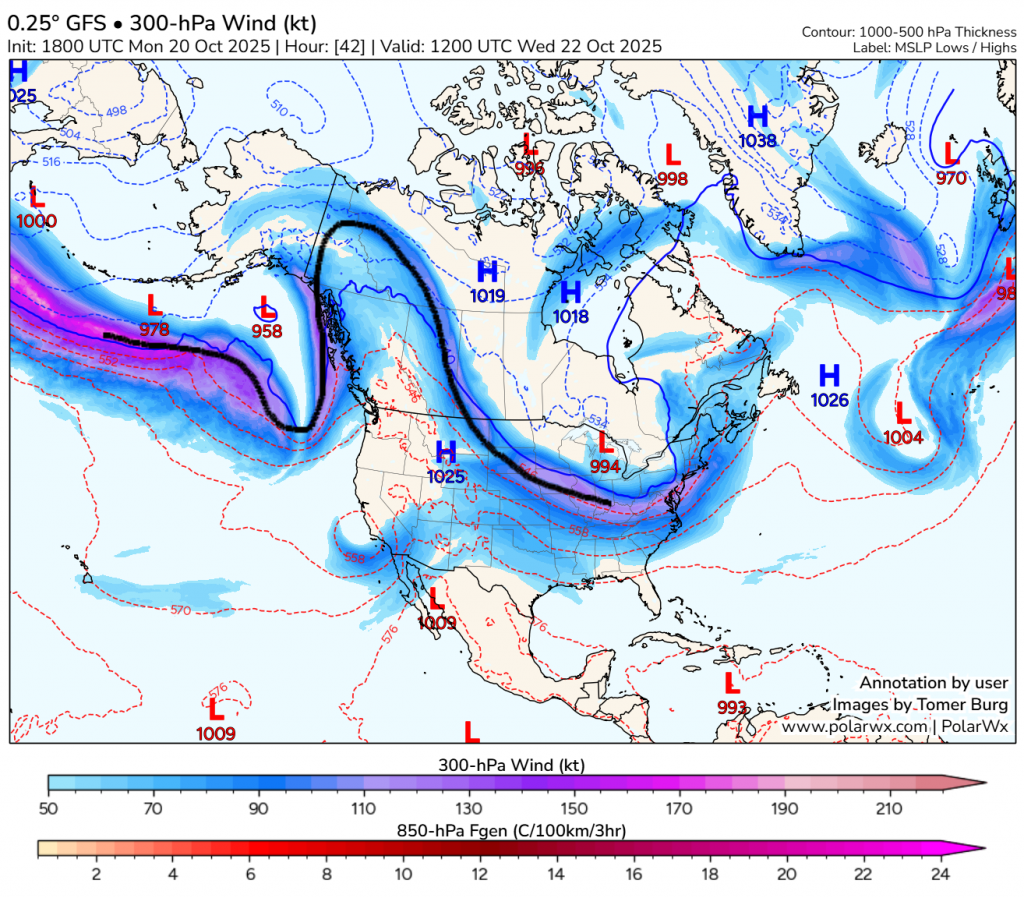
This low will then get stalled as it runs into the big mass of high pressure over AB-SK-MB, but the cloud will not. Over the day tomorrow, the cloud associated with the system will continue to move northward, and the area of precipitation will turn into something like this by the evening:

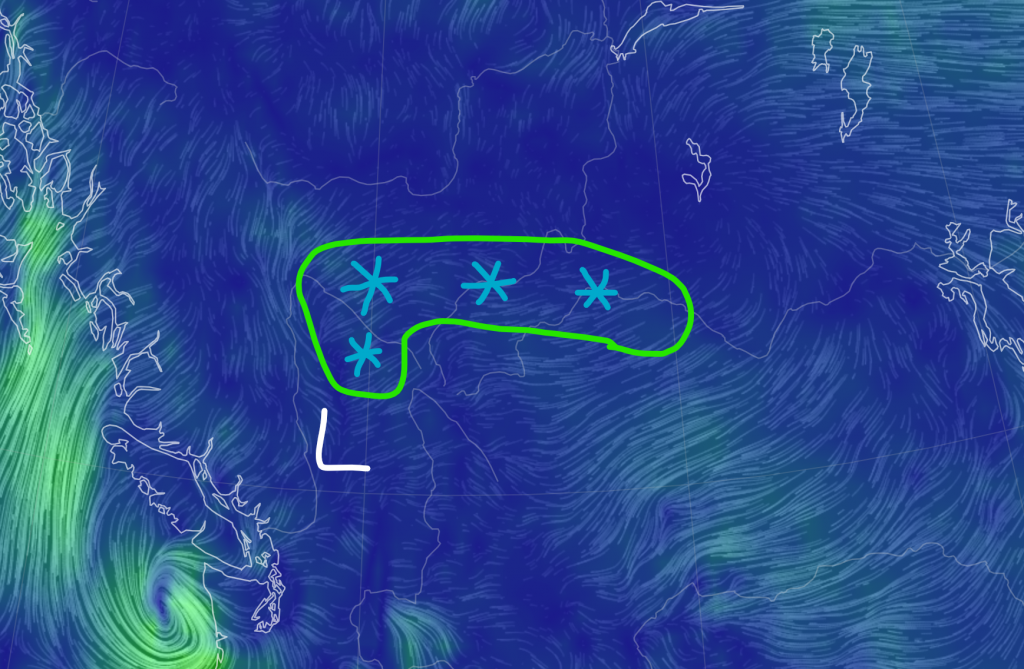
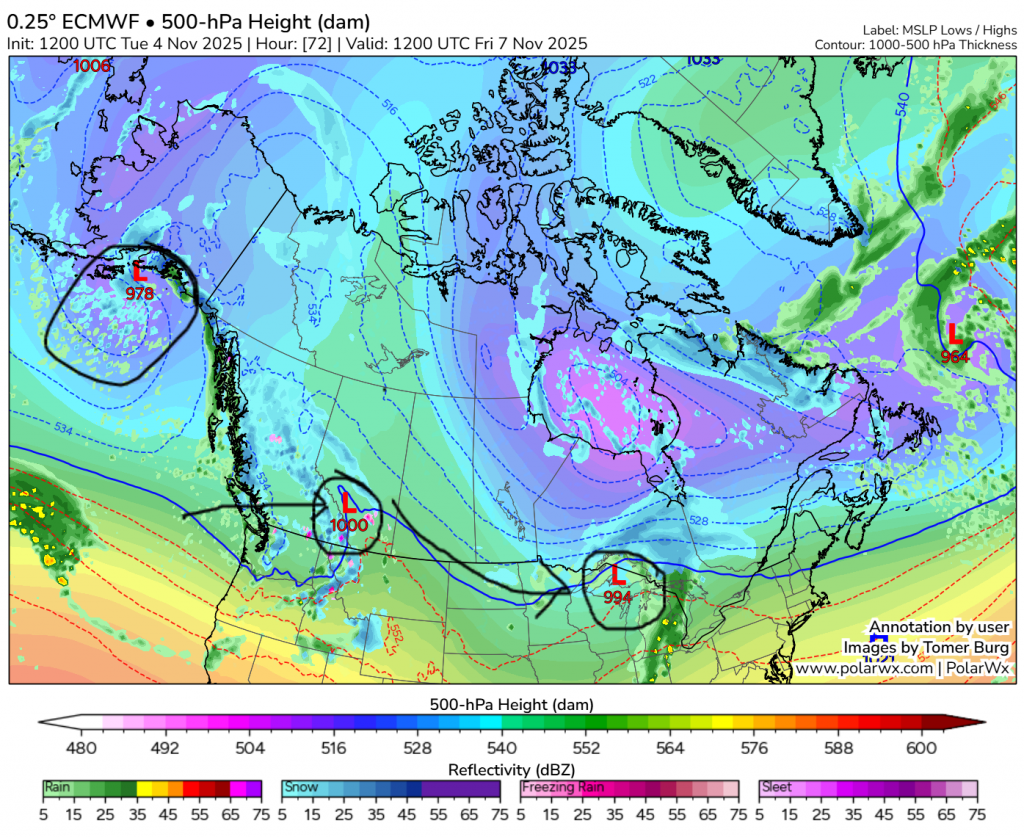
By the way, ^^^that is another low running up the coast. The other trough that split off from the main one will disintegrate by midday tomorrow.

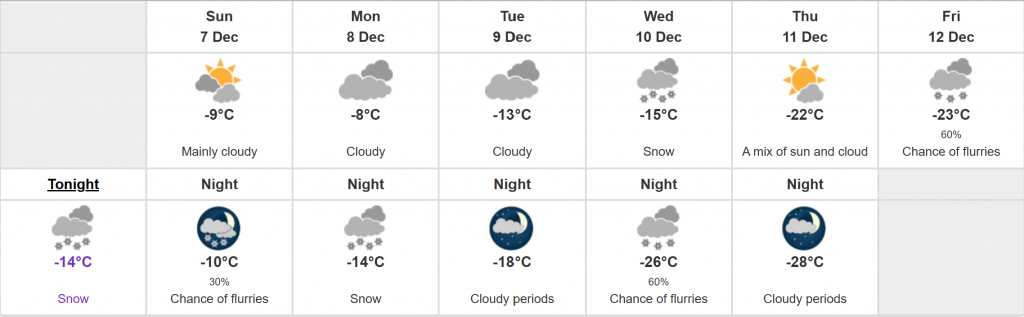
This snow that comes through will be very heavy, and will accumulate quite a blanket. As your actual forecast, expect snow to start sometime in the morning (between sunrise and noon), and end sometime in the evening. Accumulations are 10-20 cm for central Alberta (enough for a special weather statement to be issued yesterday), with the best chances at yellow snowfall warnings being situated in the Edmonton and Lloydminster areas.

One more thing, do not fret about drifting or even blowing snow. We are still going to be under the influence of the high, and the low is also far enough away that the stronger winds will not reach here.

Posted in Forecast, Precipitation, Wind | Leave a comment

A LOT of snow and near-blizzard conditions on tap tomorrow…

Hello there! Likely one of our biggest systems this winter is arriving tomorrow. On the forecast is blowing snow, very low visibilities, and most of all 10-25 cm of snow.

It will all start tonight, as a low enters southern Alberta. Usually snow will fall a good distance northward of a low, so even though the low is in southern Alberta, the snow is here. Even though we are getting very extreme amounts of snow (for December), this system is actually still a clipper. A confliction between warm air from the south and cold air from the north will create a strong stationary front, where a lot of snow will fall very quickly, and stay for about 12 hours. 12 hours is quite long for a clipper.

Total amounts of snowfall depend on where this boundary is placed. Canadian and European models have agreed extensively that the most snow will fall right over Edmonton, while US models have put it farther south. These models, however, have slowly been moving the snow northward over the last 24 hours, so most likely the Canadian and European ones are correct. I would say we have a 90% chance of >10 cm of snow falling, and about a 50% chance of >15 cm. Continuing, 20 cm of snow has about a 30% chance, and 25 cm about a 20% chance. It is only until we get to 30 cm that the chance falls below 10%.

When will this snow fall? Light snow will begin overnight tonight, then quickly turn heavy by sunrise. This heavy snow will continue all day, before diminishing tomorrow evening to a standstill at midnight. Relatively not that long, but for a clipper very lengthy.

There is also a risk of blowing snow tomorrow morning. Winds associated with this system will start overnight tonight coming from the northeast, then switch to more northerly and less intense around noon. Winds will be on average be around 20 km/h, with the strongest gusts possible above 40 km/h. This snow will definitely drift quite a lot. Temperatures will be between -10 and -20 for the duration of the snowfall, so wind chills are quite a concern.

So there you are. This snow will be quite impactful, so be aware of conditions tomorrow. Temperatures are going to go down and stay down for a while, so this snow isn’t going anywhere until spring.

Posted in Forecast, Precipitation, Wind | Leave a comment

A good coating of snow tonight, then temperatures drop to near record-breaking

It’s been a while since the last short-range forecast. Actually almost a month. Today, the drought will finally end, as some very, very cold temperatures are coming over the next few days, with a good amount of preceding snowfall.

Part 1: The snow. Starting likely within an hour or two of midnight tonight, some snow will start. It will be very steady, and possibly quite heavy and visibility-reducing. The reason for this is a low moving through southern Alberta, and a band of precipitation extending northward up until about the latitude of Peace River. Windy.com is the only website I know that shows HRDPS (High-Resolution Deterministic Prediction System, very high-res model operated by ECCC. It is the best for these kinds of precipitation situations) maps. For some reason, nowhere else it is shown. So, here’s a map from it:

This area of snowfall will be quite heavy, but certain east-west bands may become even heavier, so though most forecasts put down something in the 3-6 cm range, a lot more cannot be ruled out. This snow should be mostly over by sunrise.

Through the isolines on the map, we can see a lot of this precipitation is attached to a ridge, coming up from a large thermal high in the north. This will be bringing down extremely cold air.

Part 2: The cold. After this area of precipitation leaves, air even colder than the stuff we have right now will rush in and try to battle the normal daytime warming, and it seems it will be just close enough to keep the temperature almost exactly the same from sunrise to sunset tomorrow; somewhere around -22 or -23. As a very cold high pressure system approaches from the north, skies will clear and winds will (partially) subside. This creates the perfect conditions for extensive nighttime cooling, and with the temperature already starting at -23, we will be plunging into quite the deep freeze.

Through the evening, temperatures will drop to most likely somewhere between -28 and -32. Even with the very minimal winds, wind chill values will be approaching, if not just barely succeeding -40. -40 wind chill is definitely enough for a yellow cold warning, so one will probably be issued sometime tomorrow. To mention are that some models are seeming to be “sticky” with the low being significantly away from -30, wanting to stay around -26 (Environment Canada, mainly) or -35 (A few Canadian models). It’s on every run for these models, while all the others stay near -30.

Well there you go. That’s all I have for you. Stay warm, and don’t get frostbite!

Posted in Forecast, Precipitation, Temperature, Wind | Leave a comment

A big cold shot is coming…

After Thursday, this week has been quite cold. Temperatures have gone down quite a lot, and snow is here as well. Today when the sun was up, the temperature varied from -17.2 to -15.7. A high of -15.7 is definitely quite abnormally low. Current forecasts suggest this is only the beginning.

Here are the current temperatures, with a bunch of numbers sprayed all over it so you make sense of it:

Those -40s up at the top are a big mass of cold air anchored there. Winds are sweeping this air across the country. The 5s and 10 you see in the bottom left are an area of upper-level ridging. If you take a close look, you can see winds coming out of that area currently extending all the way to the eastern edge of the Rocky Mountains.

As we can see here, we somewhat have a battle of warm and cold: Warm air is trying to move north from the ridge, and cold air is trying to move south from the mass of it in YK/NT/NU. The actual systems that are moving that cold air down are the lows on the very active storm track we currently have. This is expected to be the pattern for the next little while for southern Alberta and BC. Warmer, but when a low moves through, temperatures drop. Thus, an alternation of above and below normal. We, however, are far enough north that the warmth is not the dominant factor. For us, it more of an alternation of mildly below normal and record territory. Yes, record territory.

This brings me to the forecast. The actual large-scale system behind this is pretty boring, basically a continuation of what I just explained in the last paragraph. For the forecast for specifically us, things get quite interesting. To start, here’s Environment Canada:

Like I said, a wave of mildly below normal (Sun/Mon), and record territory (Thu/Fri). Those highs are definitely record territory, but a low of -28 isn’t. Other forecasts have -30s for Wednesday night-Friday night.

Now let’s look at an ensemble model:

This is the Canadian one, GEPS. Ensembles wash things out as they go on, so I’ve drawn arrows for the likely temperature patterns. It has the 25-75 percentile actually getting quite close to -35 Thursday night. Even ensembles amplify temperature events as they near, so we might have a shot at getting it. -35 is definitely record territory.

Operational models also have extreme cold, and the most extreme of them, ECMWF, has us getting within a few degrees of -40. I would say we have good chances at both a minimum low and minimum high records, with temperatures to beat being around -35 and -25.

The very interesting thing about this cold wave is that we will still stay active, and the semi-clippers that we have (semi because they are tracking over us quite slow, then speed up as they exit Alberta) will continue to ring good amounts of snow repeatedly.

One more thing, we have no idea when this cold wave will end. The best thing I can say is that there is about a 90% chance of us still being in it in 10 days.

Posted in Forecast, Precipitation, Temperature | Leave a comment

Look out! It’s an outlook! (for December)

Happy December! For a quick version of the upcoming forecast, we will be probably quite snowy with a lot of temperature variation and uncertainty.

If that’s all you came for… Well, bye I guess? For the rest of you, read on for details.

This month, what are the overarching oscillations that will likely affect us? First of all, La Niña.

As you can see, we are currently at a -1. Since September (actually even earlier) It has been very slowly strengthening, but in the last week has started to weaken. I would expect the -1.2 we got about 5 days ago to be the peak of this year’s La Niña. Towards the end of winter, we might actually end up pretty close to neutral.

Related to this, we have the Indian Ocean Dipole. For a while now, it has been a battle between the two, with La Niña’s easterly winds and the negative IOD’s westerly winds meeting in the middle and causing the MJO to be stuck in phases 4-6. Why is this? The MJO is just a question of where is rising motion in the Indian Ocean and west Pacific near the equator. Around Indonesia is Phases 4-6. 7/8 is the west Pacific, and anything below 6 is in the Indian Ocean, with 1 being almost at Africa. The converging winds are just causing the rising motion.

The Indian Ocean Dipole has been quite negative for a while, but in the last two weeks weakened extremely fast and is now near neutral:

Finally, the MJO. It seems the expulsion of westerly Indian Ocean winds will cause the MJO to shift to more Phase 8, then slowly dive. These phases are usually bringing of cooler, more active weather than 4-7.

Now for the actual forecast. This week, temperatures are varying a lot, and a lot of snow is forecast. Both of these are likely good analogs for the entire month.

Here is a good graph for a bunch of different models and their temperature forecasts:

Everything under the white arrow is somewhat certain. You can get a good look at what temperatures will likely do over the next while. Throughout at least the next week will be very active and snowy, and there are currently no signs of that stopping soon. After the 12th, the models suddenly take the temperature way down, but that’s not for sure. What the red means I will get to soon.

Now, what is the pattern governing the above graph? For this week, it is this:

On this map, the yellow is the surface wind direction, and the green is the storm track. We have cold air the north and east, and warm air to the west and south. The barrage of lows expected to pass through over the next 5 days will create great day-to-day temperature variations.

Next up, the second week of December:

Now what we see is that the high has snuck into the US and cooler air stretches in a band from Alaska to the Maritimes. We will likely still stay active, and also more windy.

Around the 12th, we see a divergence. A lot of operational models but a big blast of cooler air down. The most aggressive of these right now is the ECMWF artificial intelligence model, AIFS:

It’s in Fahrenheit, but that difference from normal for us would be around 7 degrees below normal. That would likely mean lows getting close to (or maybe even beyond) -30, as events like these get amplified as they near.

The other side to this are the sub-seasonal models. They give us a heat wave and focus all of the cold in the east. The is a map for December 10-15:

This puts down much warmer air. Note that it does not stick; but rather these models put a blast of cooler air from the beginning of winter break to the beyond the end of the month.

As well, both the operational and sub-seasonal models have high amounts of precipitation, despite the temperature differences. I would say it is more likely that we have a snowy month, but that doesn’t mean it will be. Entire seasons often get characterized by just one or two events, or lack thereof.

So, our final prediction for December is:

Variable, but mainly cooler temperatures, and most likely lots of snow.

That’s it for now, thanks for reading!

Posted in Forecast, Precipitation, Temperature, Wind | Leave a comment

An arctic blast is incoming…

Starting Monday, a large pattern change will occur and we will dive to quite possibly well below normal temperatures.

To begin, we’ll talk about why. For the last many months low pressure has dominated the first 1000 kilometres off the west coast of Canada and the US, but now that is changing.

Here’s now:

Here’s a week from now:

Right now, low pressure dominates in the eastern Pacific, but a large transition will take place around the weekend, where a ridge takes that place. At this time of year, a ridge in the eastern Pacific will disturb the polar vortex (especially when it is weak, like right now), and cause it to rebound just east. This means a sudden shot of cold air. The Pacific ridge will strengthen fast over next week, and keep cold in place for quite a while.

So it was pretty simple why, so next we have to investigate the structure of the cold wave. I would guess starting Monday, temperature will begin to drop, but it wont be very fast. Only a gradual decrease of 3-5 degrees a day. Temperatures will likely stabilize around Wednesday, and stay stable for the rest of the work week.

From the 29th on, models currently diverge considerably, but the main pattern is still on most. Expect a quick ~2 day shot of even colder air, probably bringing the coldest of the cold wave, before a very rapid warmup, staying warm for about another two days, and then a possible return to cold. The exact timing of all this currently varies from starting the 29th to starting the 1st.

During the shot of even colder air, current model differences are generally between -15 and -30 for a lowest temperature.

Now finally, the snow. The begin the cold wave it seems we will have a system move pretty much straight across the entire prairies from west to east. Another system will also come up form the US and interact with it. Here is a map, to help you make sense of this:

These two lows will interact and possibly merge. If they do, the prairie low will get stalled before, and give us a lot of heavy snow. If they don’t get close enough to each other, then the low will more act as an Alberta clipper, and only give us a dusting of snow. Right now, model differences generally put down between 1 and 10 cm of snow mainly Monday morning through Monday night.

For right now, that is all you need to know. Be prepared for the cold!

Posted in Forecast, Precipitation, Temperature | Leave a comment

Good chances for aurora tonight!

Since Sunday, there has been a lot of a CME activity, and it seems we will likely see a lot of aurora tonight.

Here’s the current conditions as of about 5:20 pm:

All the blue shows that auroral activity has been very low for the last 24 hours. That little uptick at the end shows more instability.

Now, here’s the forecast:

Blue indicates calm conditions, green indicates unsettled, yellow indicates active, and red indicates a full auroral storm. As you can see, between 9 pm and 2 am we have the best chances for aurora. On the forecast during that time, we are expected to be around 10-30% cloud cover, with less earlier in that time frame.

So, watch for aurora tonight!

If you’re looking for the latest current conditions, try https://spaceweather.gc.ca/data-donnee/geomag/ssp-1-en.php. This shows a bunch of different stations across Canada!

For the forecast, go to https://spaceweather.gc.ca/forecast-prevision/short-court/sfst-5-en.php.

https://www.aurorawatch.ca also has some nice hourly measurements for specifically Edmonton.

Finally, https://earth.nullschool.net/#current/space/surface/level/anim=off/overlay=aurora/orthographic=-107.56,59.02,705 has a pretty nice interactive map for the next hour’s aurora. Click “earth” in the bottom right, then in “Control” use the little arrows to move back and forth in time.

Posted in Uncategorized | Leave a comment

Snow incoming!

Get ready. Get your winter tires. Snow is coming.

I’ll talk about amounts later, because right now we’re going to dive right into the maps.

Map #1: This is right now. Overall, the jet stream is quite undisturbed here, but we have prominent troughs in the Gulf of Alaska and Hudson Bay. Those are circled.

Map #2: Here, we are skipping all the way ahead to Wednesday night, about midnight. As you can see, the Hudson Bay trough is still in somewhat the same spot, and it will stay that way for all the maps. What is interesting is that we can see the approaching low in the Gulf of Alaska get deflected by the mountains, and heads up north to Alaska, but a little chunk of it breaks off. A lot of the recent lows (over the last month) have come the same spot the low was in in the first map, but just sat there for a while before being ushered on over the mountains by the jet extension. This one though is swiftly hopping over the mountains, meaning it will be a lot less moisture-staved than the last handful of these systems, meaning precipitation will be heavier.

Map #3: Now we are looking at Thursday morning, and we can see the low has already made it to Saskatchewan. We have a long band of precipitation along a stationary front extending behind it, going directly through our area. What is a stationary front? A stationary front occurs when warm air head-on encounters cold air, and the two temperatures create a sharp boundary. Along the front there will be lots of precipitation. This will likely bring quite a bit of snow. We can also see a second wave approaching in the Gulf of Alaska, while the original one is staying in one spot still.

Map #4: We are now looking at Friday, a few hours before sunrise. The original low has moved well off to the east, but the second is starting to give us even more precipitation. There is a lot of uncertainty for this one, but it’ll probably give anywhere from a light topping to ~5 cm, though maybe a small chance of more.

Map #5: We are now all the way out at Friday night. For the most part, the second low has exited, though a few flurries may still be left behind.

So, our overall timing is a lot of snow Wednesday evening through Thursday evening, but if temperatures are warm enough, some of that may fall as rain. A short break between lows Thursday night, then another likely lighter round on Friday, with a lot more uncertainty on how much it will give.

Now, it’s time for amounts.

We will start with some websites. Environment Canada says 11.3 cm, AccuWeather says 5.5, and The Weather Network ~10. Next, major models. ECMWF says 16 entire centimetres, and GFS and AIFS both say 5. For some other models, RDPS says 17.3, GDPS says 15.6, GEPS says 12.9, and NBM says 12.

Key: European Centre for Medium-Range Weather Forecasts (owned by EU), Global Forecasting System (owned by NOAA), Artificial Intelligence Forecasting System (owned by ECMWF), Regional Deterministic Prediction System (owned by ECCC), Global Deterministic Prediction System (owned by ECCC), Global Ensemble Prediction System (owned by ECCC), National Blend of Models (owned by NOAA).

It seems the general consensus is 10-15 cm, with the possibility of it being lower, more around 5. Why is this? It all depends on that stationary front, and how there is a bit of uncertainty on where it lands. If it ends quite close to us, we will get 10+. If it’s something farther north, lower than that.

There you go, all the information we know right now. Tomorrow would be a good time to change to winter tires and finish any yardwork if you haven’t already. If we don’t get little, this snow will probably not melt until spring! I will post updates on Element for more up-to-date information on amounts tomorrow. One more thing to note; if the certainty increases towards a lot of heavy snow, a snowfall warning could be possible.

Posted in Forecast, Precipitation | Leave a comment

Another warming trend ahead this week

After a pretty average weekend, temperatures are expected to get back up to above normal, but not by much.

It will start around midnight tonight, when a warm front will come through:

This will raise temperatures by a few degrees, and bring in a warmer airmass. There might be precipitation along the front, but most likely we won’t get anything.

For the next few days, expect highs around 13-15 and lows around 3-5, with the exception of tomorrow night, when we may actually reach the negatives.

On Wednesday night, a low will pass over southern Alberta, and some precipitation may reach here. Here’s another map:

After that, expect a quite warm Friday, with a high getting into the high teens. After Friday, it seems we may end up diving into a cold wave.

But what is the reason for all this? Well, it’s going to involve many more maps:

First of all, let’s start with right now; the first image. The upper-level flow has been very active lately, with rounds of lows circumnavigating the globe. As you can see, we can find 5 on the scope of the map. On the second map, now for tomorrow’s forecasted conditions, we can find low #2 has dissipated, while #1 has strengthened. As this low continues to strengthen, ridging begins on the west coast and quickly balloons to what we can see on the third map, for Wednesday. This is the usual pattern for North America; if there is a low in the Gulf of Alaska and nothing is blocking ridging on the west coast, it will happen.

This ridge isn’t strong though, so the heat won’t be as well. In the fourth picture, now for Thursday, we also find a weak subtropical jet is trying to form. We can also see the main jet stream seems to be breaking up a lot at the top of the ridge, which is normal for weak, tall ridges that are starting to decay.

As we get to image 5, for Saturday, we see the very small hint of a subtropical jet stream is gone, but another weak bit of flow connecting the bottom points of the ridge are connecting a bit. The jet extension (strong, zonal flow) from Siberia is pushing the stuck low over to here, and temperatures will drop quickly after the end of the work week.

Some of you may be wondering what all the red and blue dashed lines on the maps are, so here’s an explanation. They are contour lines for the distance between the surface and the altitude at which the pressure reaches about half of that. It is generally warmer when that value is higher, and vice versa. If you look very closely, you may be able to see some numbers on the lines, which is a value at the contour in decametres. The thick blue line at 540 is approximately where rain will change over to snow.

Well, that’s it for today! No posts tomorrow, but I’ll be back Wednesday.

Posted in Forecast, Precipitation, Temperature | 1 Comment

August + September Recap

It’s here. It’s finally here.

AUGUST

August began with a heat wave, before we returned to “The Pattern,” with short periods of warm and cold, and lots of rain. There was a specially potent cold wave for the 13th through the 15th, which brought a high of 13.1 on the 15th. That was about the temperature it was yesterday. However, that day it was rainy and windy, so (not including that fact that we were used to much warmer temperatures) it felt something like Tuesday. Maybe even Monday. For the last part of the month though, we had a big heat wave, where temperatures soared to the highest temperature this year – 33.3.

Here are some stats:

ValueCompared to last 5 yearsCompared to last 30 years
TemperatureMean 19.1 Highest 33.3 Lowest 7.8~0.5 degrees above~1.5 degrees above
Precipitation28.4 mm~10 mm below~20 mm below
HumidityMean 64% Highest 99% Lowest 20%
Dew pointMean 11.1 Highest 17.2 Lowest 3.1~0.75 degrees above~1.5 degrees above
HumidexHighest 34
WindMean 8.2 Highest 33 Lowest 0~1 km/h belowNear normal
GustsHighest 57
SmokeMedian ~30 AQI, 2.5 AQHI
MoistureMean ~23 kg/m²~2 kg/m² aboveNear normal
Cloud coverMean ~65%Near normal~4% above
PressureMean 1015.5 Highest 1029.6 Lowest 1006~1.5 hPa above~1.5 hPa above

Here’s some more:

  • Number of days with precipitation >0.2 mm – 10
  • Number of days with precipitation >25 mm – 0
  • Number of days with temperature <-20°C – 0
  • Number of days with temperature <0°C – 0
  • Number of days with temperature >30°C – 8
  • Number of days with humidex >30°C – 9
  • Number of days with humidex >35°C – 0
  • Number of days with humidex >40°C – 0
  • Number of days with wind chill <-30°C – 0
  • Number of days with wind chill <-35°C – 0
  • Number of days with wind chill <-40°C – 0
  • Number of days with AQHI >4 – 11
  • Number of days with AQHI >7 – 2
  • Number of days with AuroraWatch yellow alert: 4
  • Number of days with AuroraWatch red alert: 1

Records:

  • Record high of 32.2 on Aug 26, beating 32 from 1981
  • Record high of 33.3 on Aug 27, beating 31.1 from 1934
  • Record humidity of 20% on Aug 27, beating 24% from 2017
  • Record high of 32.8 on Aug 28, beating 31.7 from 1933
  • Record high of 33.1 on Aug 29, beating 32.2 from 2023
  • Record humidity of 21% on Aug 29, beating 24% from 2023

SEPTEMBER

At the start of September, there was evidence of the heat wave ending, but that didn’t happen for a while. The jet stream flow stayed very blocked, and we ended up in a heat wave for about 3 quarters of the month. In the last week, there was some cooler weather, but overall nothing substantial. This means the month as a whole ended up VERY above normal for temperatures. As well, very little precipitation occurred, with a sprinkle on the 21st, and some light showers not even accumulating a mm on the last day of the month.

Here are some stats:

ValueCompared to last 5 yearsCompared to last 30 years
TemperatureMean 16.1 Highest 29.4 Lowest 1.5~2 degrees above~3.5 degrees above
Precipitation0.9 mm~15 mm below~30 mm below
HumidityMean 56% Highest 98% Lowest 21%
Dew pointMean 6.2 Highest 14.3 Lowest -4.9~0.75 degrees above~1.5 degrees above
HumidexHighest 30
WindMean 7.4 Highest 32 Lowest 0~1 km/h below~1.5 km/h below
GustsHighest 51
SmokeMedian ~60 AQI, 3.6 AQHI
MoistureMean ~17 kg/m²~2 kg/m² above~3 kg/m² above
Cloud coverMean ~28%~12% above~15% above
PressureMean 1014 Highest 1027.2 Lowest 999.9Near normalNear normal

Here’s some more:

  • Number of days with precipitation >0.2 mm – 2
  • Number of days with precipitation >25 mm – 0
  • Number of days with temperature <-20°C – 0
  • Number of days with temperature <0°C – 0
  • Number of days with temperature >30°C – 0
  • Number of days with humidex >30°C – 1
  • Number of days with humidex >35°C – 0
  • Number of days with humidex >40°C – 0
  • Number of days with wind chill <-30°C – 0
  • Number of days with wind chill <-35°C – 0
  • Number of days with wind chill <-40°C – 0
  • Number of days with AQHI >4 – 19
  • Number of days with AQHI >7 – 9
  • Number of days with AuroraWatch yellow alert: 2
  • Number of days with AuroraWatch red alert: 4

Records:

  • Record high of 29 on Sep 13, beating 28.9 from 1923
  • Record humidity of 24% on Sep 13, beating 26% from 2009
  • Record dew point of 14.2 Sep 14, beating 13.6 from 1996
  • Record humidity of 21% on Sep 16, beating 22% from 1961
  • Record low of 13 on Sep 17, beating 11.8 from 2000
  • Record low of 12 on Sep 18, beating 11.7 from 2000

Well, that took quite a while to make. Thanks for reading!

Posted in Aurora, Past weather, Precipitation, Smoke, Temperature, Wind | Leave a comment